Self-hosted · C++20 · MIT
The open-source options trading simulator
Practise prop-style evaluations on real option chains, from Cboe’s free delayed data or your own provider, with analytics you can check.
Your API keys, your data and your trades stay on your machine.
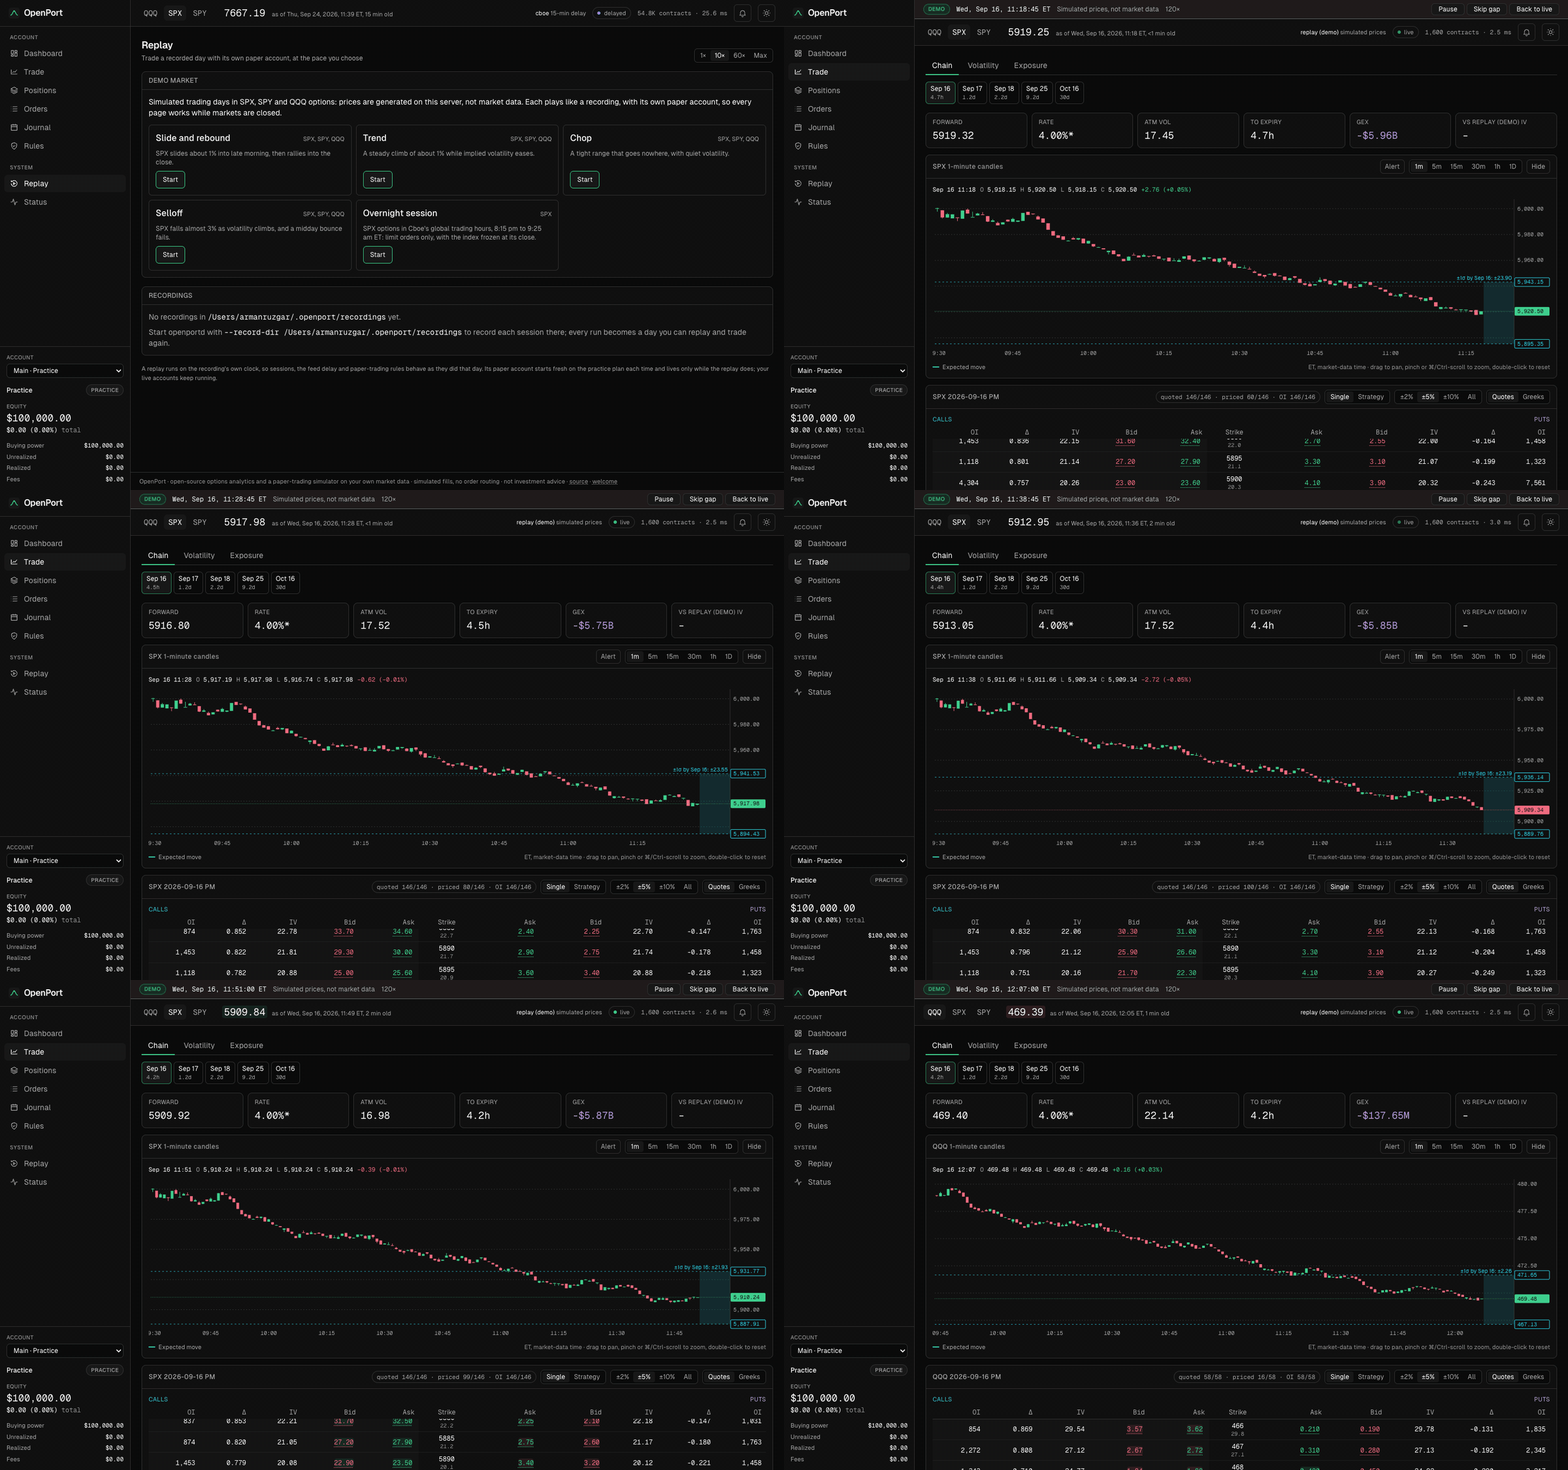
Demo market Simulated pricesShow / hide animation
Start here
Try it in one command
With Docker installed, start Cboe’s free 15-minute delayed feed for SPX, SPY, QQQ, IWM and DIA. No key needed.
docker run --rm -p 127.0.0.1:8080:8080 -v openport:/var/lib/openport ghcr.io/38st/openportOpen the link it prints, http://localhost:8080/#token=…. The volume keeps your accounts and chart history between runs. When nothing is trading, choose the demo market’s simulated prices.
The simulator
Trade like an evaluation
A profit target and a trailing drawdown floor decide pass or fail. Build multi-leg strategies, set brackets, and review each attempt in the journal. Record a session and trade it again in replay, or start a simulated day in the demo market.
Orders fill against displayed quotes. On the default delayed feed, a pass is practice, not proof: a real-time chart shows where the market went next.
Rules, fills and simulation limitsThe analytics
Analytics you can audit
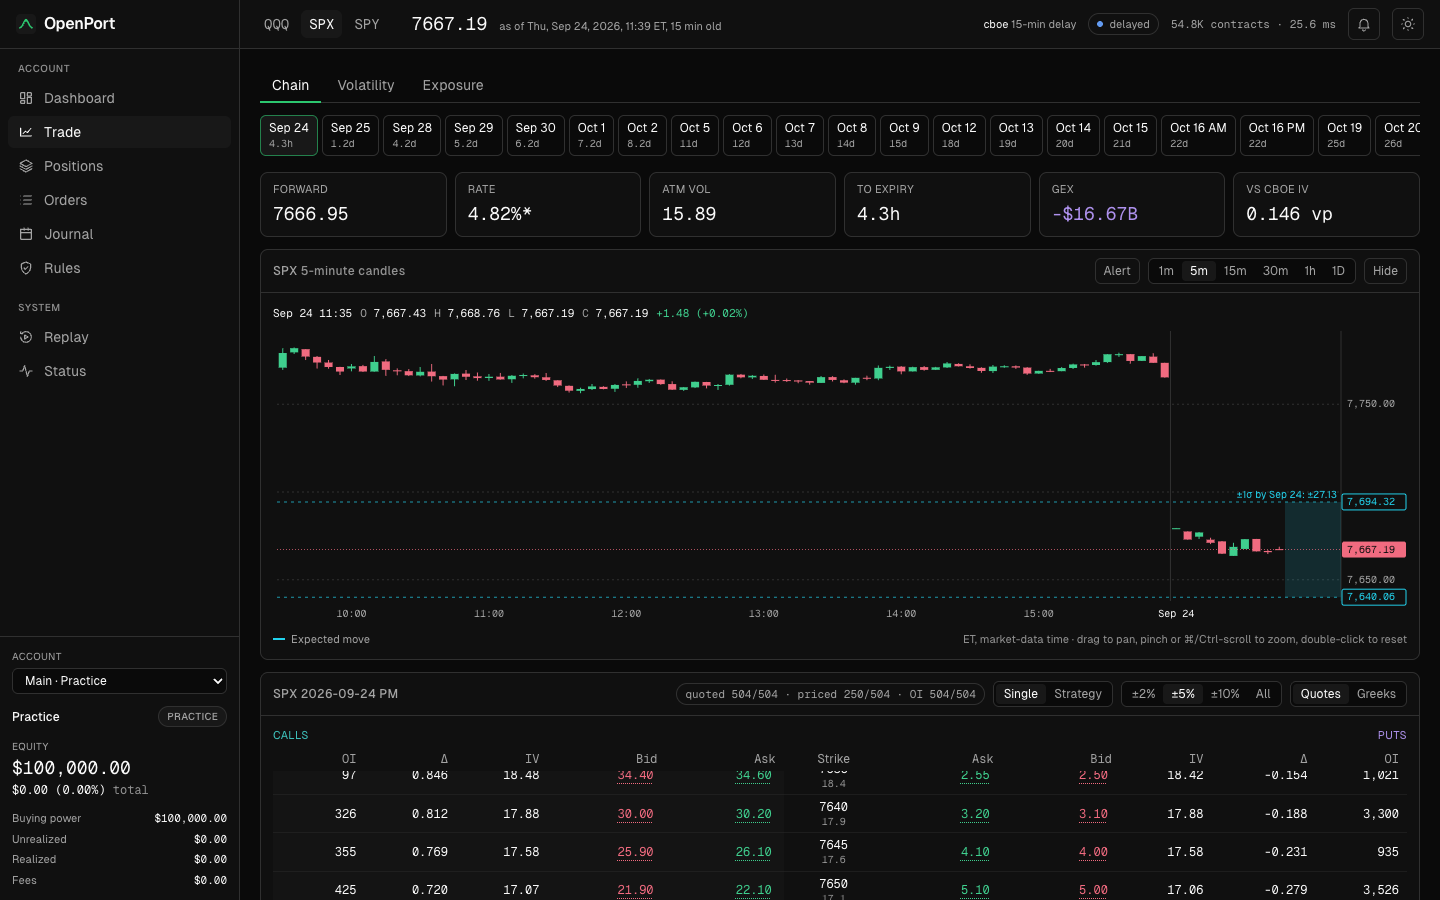
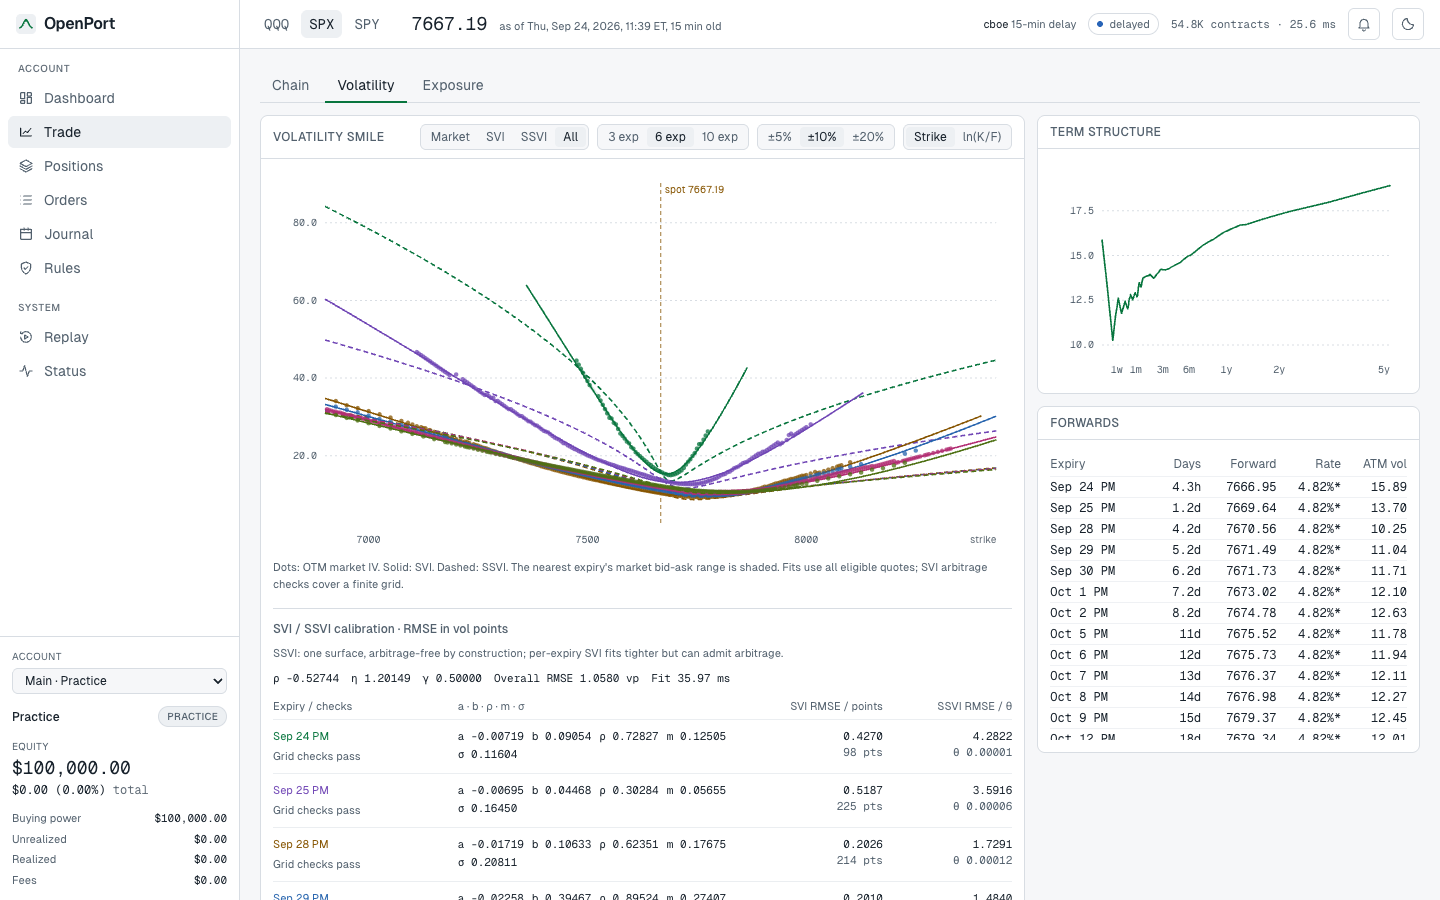
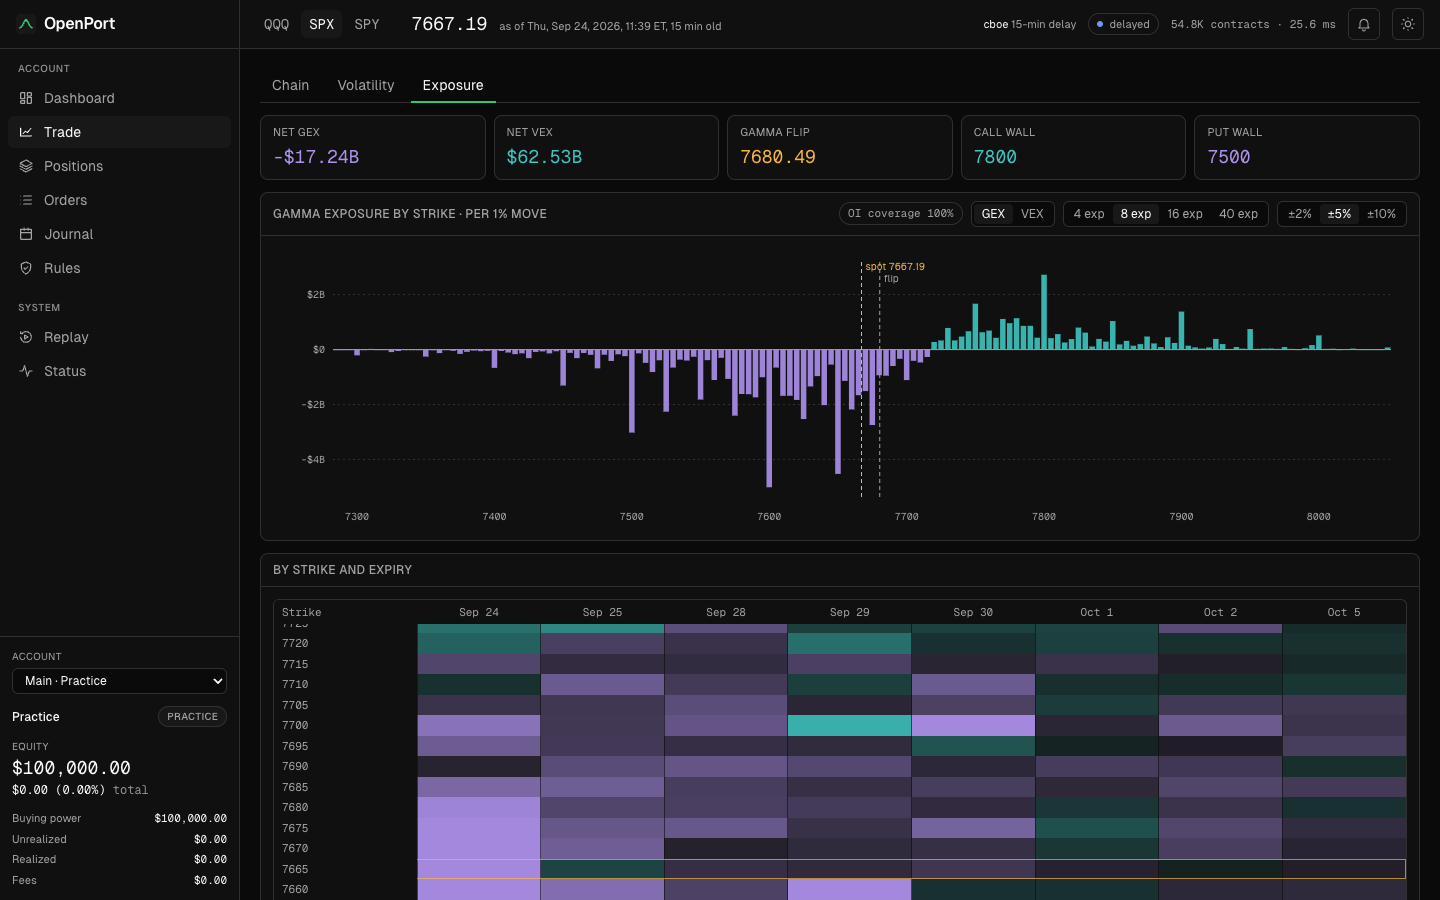
OpenPort computes its own implied volatility and Greeks, fits SVI surfaces, and shows gamma and vanna exposure. The forward and discount factor come from put-call parity; the provider’s IV stays alongside for comparison.
- IV solve
- About 0.4 µs 5.4 Newton iterations per option.
- SPX analytics pass
- About 40 ms 30,182 options, 63 expiries.
Timings are medians on an Apple M2 Max on 2026-09-24: the IV solve from openport_bench, and the SPX pass over 23 passes on live data during the session. SVI fits run separately, on demand in the API.
Against Cboe’s published IVs on 2026-09-24 during the session, median differences were 0.012 vol points for SPX, 0.030 for QQQ and 0.028 for SPY, across every expiry on out-of-the-money options within 10% of the forward.
Exposure assumes dealers are long calls and short puts: a modelling convention, not knowledge of anyone’s positions.
Methods, assumptions and measurementsOn your machine
Your data stays yours
One C++20 binary runs the feed, analytics, simulator and web terminal. Self-host it with your own keys. Start with Cboe’s free delayed quotes, or connect Databento, Massive, ThetaData, or your Tradier or tastytrade account’s market data.
These adapters follow their documented APIs and are tested against sample responses, but have not yet been run live with a key or account. The broker adapters read market data only; they never send orders.
Write a provider adapterInside the terminal
From the chain to the whole book
Recorded views of the terminal, not a live feed. All trading and P&L are simulated.